Conversion Rate Intelligence
Smart Business Decisions at the Speed of Data
Online assets (and technology in general) produce incredible amounts of data and sometimes, making sense of that data can be…well…confusing to say the least.
It’s been a goal of ours to always be at the top of our game when helping clients make sense of that data and to use that data to make intelligent business decisions.
Google Analytics has played a big role in improving your site’s performance but we always wanted more. And our clients demanded more.
Conversion Leadership Intelligence connects your website, Infusionsoft and many other systems into a simple and meaningful dashboard with metrics that relate directly to business goals.
Forget site visitors and page views. We take it beyond that. We record and display real business metrics in real-time!
If the number of new customers is important, we record and display it.
If the number of sales is important, we record and display it.
Whatever the metric, we’ll find a way to record it and display it in 1080p on a 40in TV so you’ve always got the latest data right there in front of you.
Features

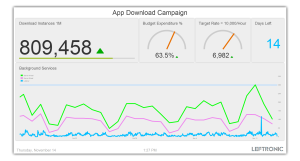
The Conversion Rate Intelligence dashboard can be easily configured to get the most insights out of your data.
See your Twitter follower count side-by-side with your Facebook page views, or your Google Analytics bounce rate next to your Infusionsoft campaign clicks!
With our elegant dashboard designs allow you to quickly see changes and patterns in all your key metrics with a sleek, lean look, allowing you to understand your company’s data without unnecessary clutter.

Start with our basic templates and quickly design online dashboards that connect to the data sources of your choice — Twitter, Facebook, Google Analytics, Infusionsoft and more!
With our dashboard connector technology you can also upload your custom data to our dashboards.
Standard connectors for spreadsheets, XML and JSON or customised for just about any format your internal systems may throw at us, lets your data can be directly integrated into a single dashboard.

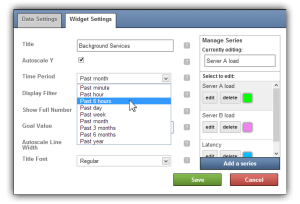
Define your data range and add in goal markers for your graphs. Get data resolutions from “on the hour” to total for the year.
Add multiple data streams to your line graphs for comparative analysis.
Track your KPIs in the time frame that you want.

With our real-time dashboards you’ll know instantly when your business needs your attention.
Keep track of your performance everyday, not just at quarterly reviews. React to problems as they occur and pounce on opportunities as soon as they arise.
Focus your team on the problems at hand and arm them with the information they need.

Since our dashboards are entirely based in the cloud, they can be easily accessed no matter where you are.
So, whether you want to view your server’s status while you’re in the office or out and about, access to the health of your company is never far away.

Have a web browser? Then you can access your Conversion Rate Intelligence dashboard. View your data on Mac, PC, iOs, and Android. It’s that simple.
Elegant dashboard designs make it easy to see your important metrics and our graphics autoscale with your screen resolution so your data is always crisp and clean.
Harness the Power of Data and Start Making Smart Business Decisions Today

